


Unit 2: Carbon Now
2.2: Exploring Limits
FOCUS QUESTION:
What are some processes of the biosphere that move carbon in the Earth system?
Introduction
Carbon moves among oceans, atmosphere, and land. The carbon cycle is part of a record of past climates on Earth, but it also acts on periods of days to years. In Lesson 2.1, you started investigating how carbon moves and changes forms in the Earth system. You looked at satellite data that showed carbon in the atmosphere and how it changes month to month. You also considered organisms with carbon, such as plants and the air from your lungs.
But there is another part of Earth that stores a huge amount of carbon: the ocean. It was in your box diagram in Lesson 2.1. In this lesson, you will focus on the oceans. This will help you better understand how carbon cycles among the land, atmosphere, and oceans. In Lesson 2.2, you will learn that:
- Photosynthesis and respiration move CO2 into and out of the biosphere.
- We can use scale models to understand larger-scale processes on Earth.
- Different factors, such as patterns of light, affect the rate of photosynthesis and respiration.
Use the focus question to help to guide your thinking about how carbon moves in the Earth system.
A. Aquatic Model
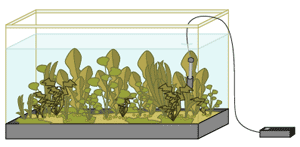
In Unit 1, you investigated carbon moving into and out of water. When carbon moves into water, it becomes part of the aquatic ecosystems. Those ecosystems could be marine or freshwater. Your class will set up a model of an aquatic ecosystem and monitor carbon for one to two weeks. And as you learn more about the carbon cycle and climate, you will see how that model represents carbon in the Earth system.
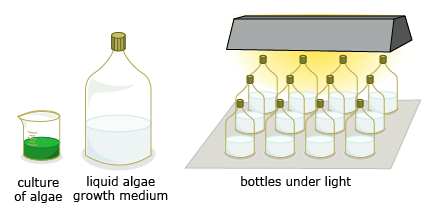
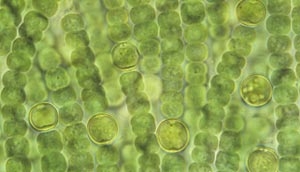
Your model uses algae in containers. Your teacher will show you the setup. You will start with a culture of algae, fertilizer (that is, a "growth medium"), and some light. Your goal is to gather evidence that carbon is moving into the system.
- Complete the following steps with a partner. Be ready to share your ideas in a class discussion.
- What you think will happen in the containers?
- What data could you collect to serve as evidence that carbon is moving into the system?
- What factor do you think is more important to the growing algae: the light or the growth medium? How could you test this?
B. Photosynthesis and Respiration
As you started exploring in Unit 1, carbon moves among oceans, atmosphere, and land. In some settings, carbon moves quickly—over periods of days or years. But what are some of the main processes in the biosphere that affect how carbon moves in the Earth system? Two vital processes involve organisms.
Photosynthesis is the process where plants use carbon dioxide (CO2), water (H2O), and sunlight to make glucose (C6H12O6) and oxygen (O2). It also moves carbon from the atmosphere to the biosphere. Only some organisms are able to use light ("photo‐") to make, or synthesize, their cells and tissues, however. These organisms are called primary producers. These include plants, algae, and some bacteria.
Primary producers are the base of the food web. All other organisms rely on primary producers. For example, a horse is not a primary producer, but it does need to eat, or consume, grass. Thus, the horse is a consumer.
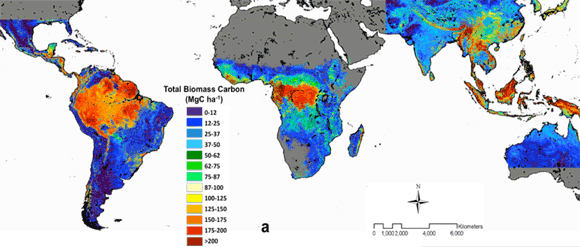
All the organic molecules, whether in an individual organism or an entire ecosystem, are called biomass. The diagram at the beginning of this lesson shows biomass for part of Earth.
Photosynthesis:
6CO2 + 6H2O + E → C6H12O6 + 6O2
carbon dioxide + water + energy from the sun → glucose + oxygen
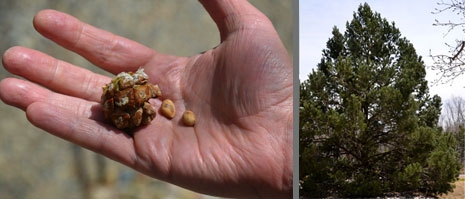
A pine tree is a good way to show the importance of this equation. It starts from a seed, but where does the mass come from for a seed to grow into a tree? Remember in our last lesson that we discovered that the mass comes from CO2 in the air. Though it does not seem like CO2 gas can produce a large tree, it does. After making glucose, the plant uses the glucose to make the cells and tissues of bark, wood, roots, and needles. It may seem hard to believe that organisms of the biosphere rely on carbon gas in the air, but they do. Whether cells and tissues are from producers or consumers, nearly all the biomass in ecosystems originates from CO2 in the air. Watch the time-lapse Radish Seed video again of a seed growing into a plant using only a wet paper towel. This is photosynthesis in fast-motion.
In Lesson 2.1, question 5b asked you where the mass of a growing plant came from. Check in your notebook for how you first answered the question. Revise your answer now based on what you are learning about photosynthesis.
But the carbon may not stay in organic molecules for long. What if the organism is using energy and burning calories to stay alive? Even organisms such as trees, plants, and algae have to use energy to stay alive. Or, if the organism dies, where does that carbon go? You have probably seen plants or foods that are rotten and decaying. Decomposers include the bacteria, fungi, worms, or insects that cause rot and decay. Decomposers get their energy from organic matter. You saw this in the Decomposition video about leaf and wood decomposition on the forest floor. In fact, nearly all organisms get their energy this way. The process is called "cellular respiration" because it happens in the cells of organisms. For an organism breathing oxygen (O2), its "food" can be represented as the sugar glucose (C6H12O6). Cellular respiration is the process of using oxygen and glucose to supply energy for the organism. This process also releases CO2 and water. The respiration reaction can be represented as:
Cellular Respiration:
C6H12O6 + 6O2 → 6CO2 + 6H2O + E
glucose + oxygen → carbon dioxide + water + energy for the organism
For some organisms, it might not appear that they have energy needs. Consider a tree or plant, for example. It does not expend energy like you do when you walk, run, or move your arms. However, it does require a lot of energy to grow the different tissues in limbs, leaves, roots, or flowers. Imagine a tree leafing out in the spring. This growth spurt is similar to the energy you use to grow. Some types of plants have poisons or molecules that keep consumers from eating their leaves. Making those extra kinds of molecules requires extra energy. That energy comes from the breakdown of organic molecules (such as glucose) during cellular respiration.
Get with a partner to answer the following questions about photosynthesis and respiration.
- You excrete some of the food that you eat. The rest of the food releases energy to cells in your body.
- What process provides your cells with energy?
- How do you get rid of the carbon from that food?
- What specific evidence from Carbon Connections do you have to support your answer?
Hint: Think back to Lesson 2.1.
- Think back to the example of leaves piling up on the forest floor. Where does the carbon go from those leaves, and what form is it in?
- Look again at the formulas for photosynthesis and respiration.
- Consider a carbon system (such as the algae model) or a larger system (such as the Northern Hemisphere). If you were trying to track the rate of photosynthesis, what could you monitor in the reaction?
- For the same system, what could you monitor in the reaction if you were trying to track the rate of respiration?
Photosynthesis:
6CO2 + 6H2O + E → C6H12O6 + 6O2
carbon dioxide + water + energy from the sun → glucose + oxygen
Cellular Respiration:
C6H12O6 + 6O2 → 6CO2 + 6H2O + E
glucose + oxygen → carbon dioxide + water + energy for the organism
- You will keep your algae model under a light. Imagine that you kept the algae in the dark and gave it other food, such as glucose in the water. Predict what you think would happen to the CO2 levels and pH of the water with time.
Hint: It will help you to refer back to Lesson 2.1, where you wrote in a table the relationship between CO2 and pH in water.
Perhaps your class cannot do the algae model. To see the results of another class of students who did the algae model, view the images at the bottom.
C. Aquarium Ups and Downs
In the carbon cycle, carbon moves at different rates. For an ecosystem or region, this depends on whether photosynthesis is faster than respiration (P>R), or whether respiration is faster than photosynthesis (R<P).
You can explore real data to find out if photosynthesis or respiration is faster. These data were collected by high school students. The students had learned that oxygen was produced in photosynthesis. They put a large number of aquatic plants in an aquarium. They put the aquarium near a window in a room with no other lights. Using probes, they measured the dissolved oxygen and pH for two days. The student data is in the following graph. With a partner, explore the graph of the student data.
- Answer these questions about photosynthesis and respiration in the aquarium when it is dark at night. Copy a table into your science notebook like the one shown. Record your findings in the table for the steps below.
- At night, does photosynthesis (P) or respiration (R) have a faster rate? For example, if photosynthesis is faster, show this as "P>R" in the table.
- Is oxygen being produced or consumed by the plants? Draw an arrow in the same row in the table below to show an increase (↑) or decrease (↓).
- At night, is CO2 being produced or consumed by the plants? Draw another arrow in the same row in the table below to show an increase (↑) or decrease (↓).
- The pH of water around the plants is a proxy for CO2 in water. Referring back to Lesson 2.1, step 6, (or even Lesson 1.1), how does pH change when CO2 in water changes?
| Time | Rate of Photosynthesis (P) versus Respiration (R) | Oxygen (O2) in Water | Carbon Dioxide (CO2) in Water | pH of Water |
|---|---|---|---|---|
| Night | ||||
| Day |
- Repeat the steps above for the aquarium during the day.
- The students who graphed the data could have shown where day and night are. That should never happen in your school! Identify the times when you think the plants are in the light, and when they are in the dark. Do this by shading the graph for the time that you think is dark.
D. Going Global
Now, let's go global! You can explore whether the physical processes in the aquarium or your algae model are also reflected in three key parts of the global biosphere. You will look at a few sources of data below for land, oceans, and atmosphere. Complete these steps with a partner.
- The first set of data shows the amount of vegetation on all the Earth's land.
- Read the following to help you understand the video:
Another way to indicate whether photosynthesis is greater than respiration is by knowing the net primary productivity. This indicates how much photosynthesis is being done by primary producers in ecosystems. High values mean that the rate of photosynthesis is much greater than respiration. Carbon dioxide (CO2) leaves the atmosphere and goes to the plant to support its growth. - Imagine that the video did not have months on it. Would you be able to tell when it was winter where you live? How?
- Read the following to help you understand the video:
- Photosynthesis and respiration also occur in the oceans. The image shows high productivity in the southern Atlantic Ocean (green, light blue). The second video shows productivity in all oceans.
- Read the following to help you understand the video.
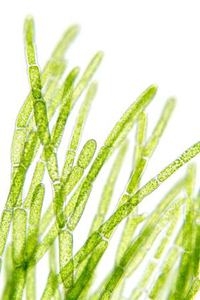
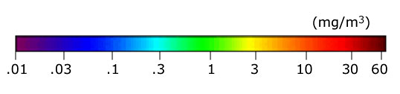
At certain places and times, the ocean comes to life. Productivity increases dramatically as photosynthesizing organisms reproduce and thrive. They need carbon to do this. Some of the main photosynthesizing organisms in the ocean are algae and blue-green bacteria (cyanobacteria). Scientists use NASA satellites to estimate the productivity at those times. They also measure the amount of chlorophyll in the oceans. Chlorophyll is a molecule used by organisms in photosynthesis. It is the reason that plants and other producers are green. - Look at this key for ocean productivity from the video. The scale is milligrams of chlorophyll per cubic meter of ocean water. What colors indicate the highest productivity?
- In what parts of the ocean is productivity highest? What regions are the lowest?
- Read the following to help you understand the video.
- Another part of the biosphere does not have much biomass, but it has a lot of carbon: the atmosphere! This is included so you can see the full "breathing biosphere."
- Read the following about carbon in the atmosphere.
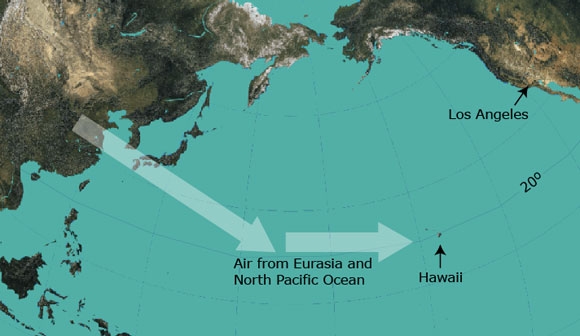
Exploring CO2 levels in the atmosphere helps you learn about carbon in the biosphere. Scientists gather important data comes from Mauna Loa observatory in Hawaii. Air arriving there is a mixture of air that has passed over Europe, Asia, and the Pacific Ocean. The CO2 levels in the air tell of the photosynthesis and respiration of the ecosystems that the air passed over before arriving at Mauna Loa. - Note these points in the graph. Over the year, it shows a breathing biosphere.
- The y-axis is CO2 levels of the air crossing the Pacific Ocean and arriving to Mauna Loa from Europe and Asia.
- The x-axis is months of the year, January through December.
- In the fall and winter, CO2 levels increase. What does that tell you about the rate of photosynthesis and respiration? Use the symbols >, <, or = to complete the following sentence:
In fall and winter in Europe and Asia, the rate of photosynthesis is _____________________ the rate of cellular respiration. - In spring and summer, CO2 levels decrease. What does that tell you about the rate of photosynthesis and respiration? Use the symbols >, <, or ≥ to complete the sentence below:
In spring and summer in Europe and Asia, the rate of photosynthesis is _____________________ the rate of cellular respiration. - You can see all these parts of the breathing biosphere in a single video. Read the following questions with a partner, and then watch the CO2 Levels video. (You can watch the video more than once.)
- How many years are shown in the video?
- When the productivity is high in the Northern Hemisphere, what is happening to the CO2 levels?
- Read the following about carbon in the atmosphere.
E. Reflect and Connect
Complete Lesson 2.2 with the questions below.
- Your algae model will be in the light the whole time. This will help the algae increase biomass faster. Do you expect your results to show a similar pattern for CO2 levels in the aquarium investigation?
- How are the CO2 patterns at Mauna Loa similar to, or different from, the aquarium experiment?
- Return to your focus question to describe some processes in the biosphere that move carbon. List the processes and explain how they move the carbon.
- Write in your notebook your explanation of the breathing biosphere. What does this phrase mean to you?
- Factors other than light can affect the rate of photosynthesis and respiration in the biosphere. To learn more about them, see Explore More: Rate-Limiting Factors on Photosynthesis.
In this unit, you are studying how to track carbon as it moves in the Earth system. Knowing how carbon cycles today will help you make informed decisions in the future. It also helps us understand changes to the amount of carbon in the atmosphere in recent times. Understanding changes in the amount of carbon is important in thinking about future climate.
Explore More: Rate-Limiting Factors on Photosynthesis
Rate-Limiting Factors on Photosynthesis
South Atlantic Ocean
You have seen how patterns of light affect the rates of photosynthesis and respiration. This can be day or night patterns, or seasonal patterns of light. You can investigate another factor that might limit productivity in the oceans: nitrates. Rate-limiting factors are factors such as light or nitrates that affect the total productivity in an ecosystem.
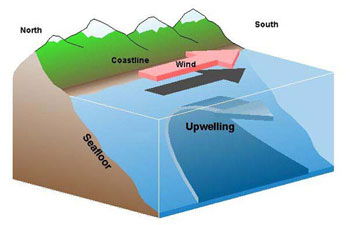
Nitrates contain the essential element nitrogen. Plants and all living things need nitrogen to grow. You can provide nitrogen to plants with fertilizer. You may have learned that nitrogen is a part of DNA and RNA. Nitrates and other nutrients are also often found in cold, deep waters of the ocean. Along coastlines, winds can move surface waters away from the shore. Colder, deeper waters move up to replace the surface waters. This process is called upwelling. Upwelling brings nitrates and other nutrients to the photic zone. The nutrients are vital to productivity in marine ecosystems. A lack of nitrates can limit the growth of primary producers.
Investigate with a partner whether light or nitrates limit productivity in the southern Atlantic.
- Discuss with your partner whether you think light, nitrates, or both could be a limiting factor for productivity.
- Recall that the amount of chlorophyll indicates total productivity in the upper oceans. Use the RLF (rate-limiting factor) interactive to see how light and nitrates relate to the amount of chlorophyll. To use it, follow these steps.
- Open the RLF interactive. The top map shows chlorophyll. What colors indicate the highest levels of chlorophyll (mg⁄m3)?
- Select either nitrates or light as a rate-limiting factor. Explore the relationship between chlorophyll and the factor by clicking month by month. You can also view an animation by selecting "Loop Year."
- Work with your partner to make a claim about whether light or nitrates limit productivity. With your claim, list key pieces of evidence to support your claim.Compare the other factor with chlorophyll levels.
- Go to the Correlation Map. You can use data in this map to test the claim you made in step 2. To make this map, data for each small "dot" (location) is compared across the year. The map uses color to show if there is a positive relationship, no relationship, or negative relationship for each location.
Positive relationship: If two variables change in the same direction together (increase or decrease), then the relationship between the variables is positive. This is also called a direct relationship. For example, suppose you measured two variables on yourself from the time you were born until today: height and weight. You would see that, over time, as your height goes up, so does your weight. These variables have a strong, positive relationship. Strong, positive relationships are shown in orange. If a factor is a limiting factor, you would expect that productivity (chlorophyll) would go up when the factor also went up. A positive relationship indicates that a factor may be a limiting factor. In other words, it could be a cause.
No relationship: Some variables do not affect each other. If one goes up, the other may go up, go down, or not change. These cases are light blue or light green. Here is an example that may have no correlation, or perhaps a weak one: plotting whether hair length correlates to student height. There might not be an overall relationship, but could it depend on gender? You could test that!
Negative relationship: When two variables change in opposite directions, the variables have a negative, or inverse, relationship. Negative relationships are shown as purple or blue on the maps. For example, the more you eat, the less hungry you are and the less you can eat.
If you are unable to see the interactive, click here to open it in a new tab.
Other Rate-Limiting Factors in Oceans
So far, you have seen that light can be a limiting factor for productivity on the land and in the oceans. If productivity is limited, carbon moves more slowly from the atmosphere to the ocean or land. What other limiting factors might also play a role?
You can select one of three areas to explore. For each area, you will be able to view the concentration of chlorophyll for each month across an entire year. You can compare this with three other variables that might affect the amount of chlorophyll.
Nitrate: Nitrates contain the essential element nitrogen. Plants, algae, and all living things need nitrogen to grow. A lack of nitrogen can limit the growth of producers. Scientists can use data from NASA satellites to calculate the concentration of nitrates. You added some growth medium to your algae. A main chemical of the growth medium is nitrate.
Light: NASA satellites measure the amount of sunlight across the globe. Plants and algae use light in the visible range (400 to 700 nm) for photosynthesis.
Aerosols: Aerosols are small solid or liquid particles suspended in air. A higher amount of aerosols may indicate a large amount of dust or smoke from a fire. Dust carries many important nutrients for plants and algae, including iron. So aerosols are a proxy for measuring the amount of iron. Iron may limit the growth of plants or algae.
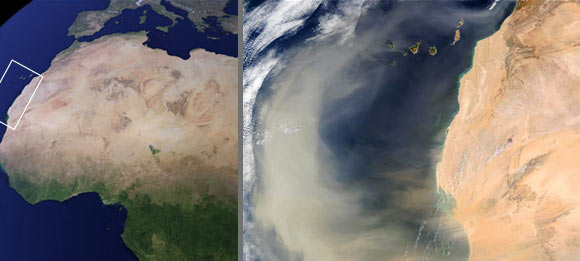
These satellite images show a dust storm in western Africa. Particulates are swept from the Sahara Desert to the Atlantic Ocean. Nutrients in the desert dust serve as a "fertilizer" for the marine food web in the Atlantic Ocean.
The next RLF Viewer has three other areas to investigate productivity and carbon movement in marine ecosystems. Select a region to investigate with your partner.
- Predict which variable you think will show a strong positive relationship with productivity in your region. In other words, when this variable is high, productivity (marine chlorophyll) will also be high.
- Record in your science notebook what you and your partner see in the interactive. In general, when the variable has a high value, is productivity high? When the variable is low, is productivity low?
- Explore each of the variables. You may also want to look at the correlation maps for each variable: They include valuable information. Which factors have the strongest correlation with chlorophyll? These would show as maps with the most orange in the correlation map.
- Summarize what you learned about rate-limiting factors in other parts of the Atlantic Ocean or the South China Sea.
- Which geographic regions did you investigate?
- Which rate-limiting factor had the best correlation with ocean chlorophyll and productivity? Use a claim to answer this question.
- List the evidence from the interactive that supports your claim in the previous step. Use examples of locations, colors, and variable values to support the correlation.