


Unit 2: Carbon Now
2.4: Carbon Cycling
FOCUS QUESTION:
What are some ways to understand how humans connect to Earth's carbon cycle?
Introduction
In Unit 2, you have explored photosynthesis and respiration. These processes have been part of the carbon cycle for millions of years. But now, humans like you are involved. In Lesson 2.3, you saw the human effect of the CO2 record from Mauna Loa. In this lesson, you will investigate more how humans have become part of the carbon cycle.
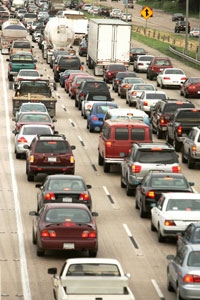
One way humans are part of the carbon cycle is by using fossil fuels. These are used to generate the electrical energy that you need and use each day. At the same time, using fossil fuels also relates to climate. In this lesson, you will see that it is not hard to make decisions for how to use a little less energy. In particular, you will learn that:
- Fossil fuels consist of carbon from the past that has been stored in the geosphere and is used by humans.
- Forests and oceans can take up only some of the fossil carbon (about 50 percent) that is added back into the Earth system by humans.
- Fossil fuels are a key part of generating electrical energy for use by humans.
Use the focus question above to guide your work through this lesson.
A. A Bright Idea
The electrical energy at your house or at your school probably comes from fossil fuels. But how much electrical energy do you use? This connects to your use of fossil fuels. Explore this in the following activity. It will help you make connections among you, your community, energy use, carbon, and climate.
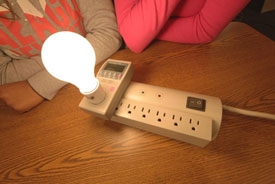
- Your teacher will show you a common object. What words are written on it? What do words such as "40 watts" mean to you?
- From your experience, you have an idea of how much light a 40-watt bulb emits. If the bulb was not labeled correctly, can you think of a way to measure its energy use?
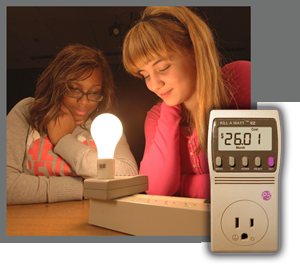
- Your teacher will show you a device to measure energy use. Complete the following steps to compare the energy use of a 40-watt bulb with other appliances in your classroom.
- List in your notebook appliances that are plugged into a wall, cord, or power strip in your classroom. These might be printers, computers, monitors, projectors, or lights.
- When they are on, do they use more or less electric energy than a 40-watt bulb? As a class, also discuss which appliances might use the most (or least) amount of energy.
- Choose one or two of these appliances and measure how many watts it uses. Record your data.
You can measure the energy use of other appliances in your school or home. What are you curious to measure? How much energy do you think it takes to recharge a cell phone? You'll be able to test a variety of appliances to answer these questions.
B. Modeling Carbon Cycling
Earlier in this unit, you considered the idea that planting trees could remove some of the carbon that humans have added to atmosphere. That is tougher when respiration is also happening and the number of trees on Earth is decreasing.
Scientists also know that a lot of carbon is stored in the oceans. In Unit 1, you used a model of carbon moving into and out of water. Could some carbon that humans add to the atmosphere be stored in the oceans? You will test this idea in this section.
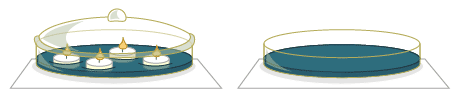
- Your teacher will show you the setup for an experiment like the one above. Complete the following steps as a class.
- Get water that has BTB.
- Place each of two dishes on a white piece of paper. Pour the BTB water to a depth of about 0.5 cm in each.
- Gently place four candles one of the dishes and light the candles.
- Place a lid on the glass container, but do not let the flames go out. As they dim, gently slide the lid sideways to let in oxygen.
- Carefully observe the color of the water in each dish. Record your observations.
- What substance do you think is causing an effect in the dish with candles?
Hint: If you need a reminder, see Carbon Indicators—Responding to Reactions.
- Draw your experimental setup. This drawing should take up half a page in your notebook. Make sure to label the BTB water, candles, glass dishes, and lid, and which is experimental versus control. Use colored pencils to show the BTB water and any changes you observe.
- Read the following to learn more about burning candles:
Look at a burning candle. Most of the light and thermal energy is from the combustion of the wax. But what is wax, and what are its carbon connections? Wax is a molecule called a hydrocarbon. These consist largely of the elements hydrogen and carbon. In fact, a hydrocarbon may have helped get you to school today if your transportation used gasoline. Many hydrocarbons have a general formula CnH(2n+2), with n being a chain of 20 to 30 carbon atoms. For example, one molecule in wax is C20H42. Octane in gasoline is C8H18. In the model you used, burning wax was the type of hydrocarbon. When hydrocarbons burn, CO2, H2O, and energy are released. - Return to the drawing of the experiment you did. From the reading above, add labels for the different forms of carbon, even if you cannot see them.
C. Carbon, Then and Now
You have studied the flow of carbon dioxide due to respiration and photosynthesis by living things. Those organisms are on land and in the ocean. These processes were shown in a box diagram at the end of Lesson 2.1. From Mauna Loa data, you saw how a human influence led to a steady rise in CO2.
Continue with the steps below to learn how to represent the human influence in the box diagram (box model).
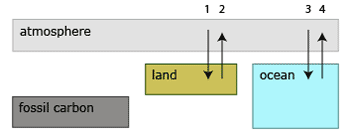
- Look at the box model for the carbon cycle. It shows a time before the Industrial Revolution (∼1850). Discuss these questions with a partner:
- Which box in the diagram stores carbon in Earth?
- Which arrows on the box model are affected by respiration? Which arrows are affected by photosynthesis?
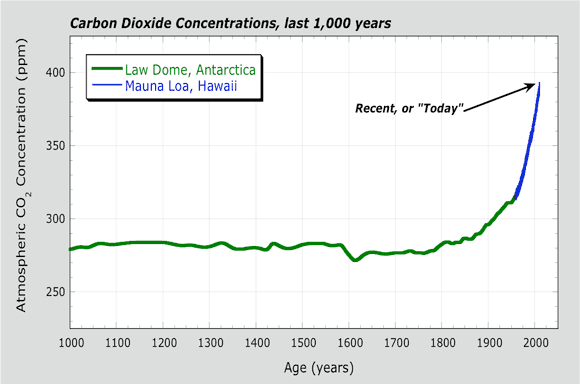
- Look at the Carbon Dioxide graph. It shows how CO2 has changed over the last 1,000 years. It combines data from Mauna Loa and Antarctica. Discuss the questions below with your class or a partner.
- For about 800 years, atmospheric CO2 did not change much. At about what year did CO2 start to increase?
- Look again at the box model above. The box model applies to the period before about 1850. The model needs revision for periods after about 1850. From which reservoir did the extra atmospheric carbon dioxide come? Why do you think this?
- Discuss with your partner how you would revise the box model to show carbon moving among reservoirs in modern times.
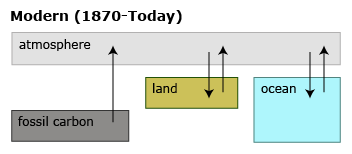
- During the industrial revolution, coal became commonly used in industry and transportation. Compare the box model in step 8 with a box model for modern times. Complete these questions with a partner:
- How are the models similar or different?
- Why do you think the arrow from "fossil carbon" to "atmosphere" is one way?
- Why do you think that the arrow from "fossil carbon" goes only to "atmosphere," and not to "land" or to "ocean"?
Explore More: Reservoirs, Where Carbon Resides
Reservoirs, Where Carbon Resides
Carbon is in all of Earth's systems. In science, you may have studied how carbon is part of living matter (biotic). But carbon is a part of non-living matter (abiotic) as well. You have seen how carbon as CO2 is in the atmosphere. The oceans also hold carbon in many forms; that carbon moves among the oceans, atmosphere, and land. These connections with the carbon cycle will help you better understand climate science.

Places on Earth with lots of carbon are called carbon reservoirs. They are like reservoirs that hold water, except that carbon reservoirs hold carbon. Because carbon can move among reservoirs, it is called "active" carbon. The middle and deep oceans are the largest reservoirs. In these places, the stored carbon is slow to mix and interact with the atmosphere.
Five other important reservoirs have carbon that moves at a much faster rate. They are soils, surface ocean waters, vegetation (land plants), and the atmosphere. Surface waters of the ocean are the upper several hundred meters of water. This includes the photic zone. These parts of the ocean have abiotic carbon, as well as most of the marine life in marine food webs. Land carbon consists of all the carbon in vegetation and soils.
Explore More: What Are Fossil Fuels?
What Are Fossil Fuels?
You may not think about it often, but you benefit from fossil fuels every day. The common fossil fuels are oil, natural gas, and coal. This carbon has been stored in Earth for millions of years. Humans figured out how to recover those fossil fuels from the ground and use their energy. You, as part of our modern world, rely on fossil fuels. When you use fossil fuels, you also release CO2. Part of the answer to "What is a fossil fuel?" is in the word "fossil." Maybe you have heard that fossil fuels came from dinosaurs; however, most of the carbon in fossil fuels came from primary producers (photosynthesizing organisms), and not consumers (such as dinosaurs). Many of the fossil fuels we use today were actually formed before dinosaurs walked the Earth. For example, large reserves of coal in the eastern United States formed much before dinosaurs existed. Other coal deposits are younger than dinosaurs.
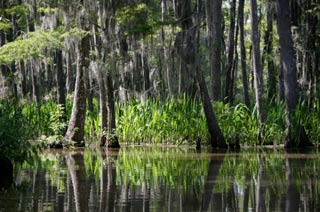
Two key types of fossil fuels are coal and oil. Coal was formed in swamps and wetlands millions of years ago. As plants growing in these areas died, they accumulated at the bottom of the swamp, and were submerged under water. Bacteria partially decomposed these dead plants. The decomposition process lowered the pH and resulted in anaerobic conditions (low oxygen). This killed the bacteria that decomposed the plant material. Under the right conditions, the partially decomposed plants became peat. People can burn peat for energy. Some peat was buried even more deeply, under layers of sediment. The pressure and heat inside the Earth transformed peat into coal. Through this long process, carbon from the ancient swamp plants is now stored in the carbon of the coal. Just think: The carbon in that coal was originally removed from ancient atmosphere by photosynthesis long ago. Your modern fossil fuels were a part of ancient carbon cycling.
In contrast, most of the crude oil you use came from tiny primary producers in shallow seas, not large plants on land. A drop of seawater can contains more than a million of these tiny organisms. These organisms took CO2 from the water and synthesized tissues for their bodies. When they died, these tiny organisms, and other organic material from the top of the ocean, settled down to the bottom of the ocean.
At certain times, so much material rained down to the ocean depths that decomposers could not keep up. Additionally, the decomposers at the seafloor used up the oxygen; so, some living matter did not fully decay. This organic matter mixed with the sediments and was then covered by more and more sediments. Over millions of years, the pressure and heat from the Earth combined to cook this once-living material into oil. Through these processes, the carbon of tiny ancient ocean organisms is now stored in the carbon of oil.
These deposits provide different kinds of hydrocarbons. In forming coal and oil, molecules made of carbon, hydrogen, oxygen, and few other atoms are changed into molecules containing mostly carbon and hydrogen. This chemical make-up means that these molecules store a lot of energy, along with a lot of carbon. Some common examples of hydrocarbons are show below.


D. Who Left the Lights On?!
You have seen it. At home, school, and work, someone leaves lights on when everyone has left the room. At home, you might get in trouble for doing this. Lights use electricity, and generating electricity at power plants usually requires burning coal or other hydrocarbons. You also have evidence from the candle investigation that burning hydrocarbons emits CO2.
Complete the following steps to explore further how hydrocarbons relate to the electrical energy you use.
- Join with a partner to discuss these questions. Write your ideas in your notebook.
- How might increasing energy use connect with increasing CO2 in the atmosphere?
- What are two actions you can take to reduce your fossil fuel use?
- How could you use an Energy Use Monitor to measure how much less energy you are using?
- Be prepared to share your ideas with other students in your class. You might even have some new ideas for your family.
- Look at the graphic below. It shows the sources and uses of energy in the United States in 2005. Use the graphic to answer the following questions.
- What portion of the total energy supply is for residential (household) uses?
- What inputs to the energy supply are fossil fuels that emit high amounts of CO2? What percent of the total are they?
- What portion of the total energy supply is for transportation?
E. Reflect and Connect
Use the following questions to help you make connections between some models that you used in this lesson, the carbon cycle, and energy use. Listen to your teacher for instructions; he or she may decide to do this as a whole class discussion or activity.
- Complete these questions:
- The wax in candles is a hydrocarbon, which you burned when you lit the candle. Name three areas of your life that involve burning hydrocarbons.
- Two main gases were released from the burning candles. What were they? Did you see any evidence for them?
- You saw the water in the closed container change color. What could that represent in the real world? What is another lesson in Carbon Connections where you modeled something similar?
- What do you think would happen to your candle model if you put algae in the water, and the algae had a source of nutrients for growth?
- Imagine that the rate decreased for carbon uptake in the water. What would happen to the CO2 levels in the air above the water?
- Return to the box model for modern times. How many reservoirs and arrows in the model were represented by the candle experiment? Show them in their own diagram, and add labels that help show carbon cycling in the experiment.