


Unit 2: Carbon Now
2.3: The Breathing Biosphere
FOCUS QUESTION:
How can simulations and models help you understand the annual breathing of the biosphere?
Introduction
In Unit 2, you are exploring carbon that is moving through the Earth system. After an aquarium experiment, you are now thinking about systems as big as Earth. Photosynthesis and respiration are key natural processes in the carbon cycle. Factors such as the amount of sunlight can limit or control how fast those processes act.
Another way to explore Earth's moving carbon is with models and simulations. That is what scientists do; it helps them test forcings and responses. In this lesson, you will use models of CO2 levels in the atmosphere to understand the processes that move carbon. You will also be able to compare the natural processes with the human influence. In Lesson 2.3, the main learning goals are:
- Photosynthesis and respiration are two important processes that help in understanding the patterns of CO2 in the atmosphere.
- CO2 in the atmosphere has a trend that is steadily rising because of human activities and the use of fossil fuels.
- Scientific models and simulations help you understand the transfer of carbon by different processes in the Earth system.
As you continue with this lesson, use the focus question to guide your learning.
A. Carbon Accounting
Maybe you've heard the idea to "plant a tree" to reduce CO2 in the atmosphere. This may be true if only trees did photosynthesis; however, all organisms, including you and plants, also respire CO2 to the atmosphere. If the biosphere has both processes, what is the net change in CO2 in the air around them? In this lesson, you will answer this question by using a model.
You can think of carbon in the atmosphere like a bank account. If you put money in, your bank balance increases. That is a positive flow of money. When you take money out, your balance decreases. That is a negative flow of money. A useful term in systems-thinking is the net flow. The net flow is the sum of the amount in and the amount out. If more money is leaving your account than is entering, the net flow is negative. It may be time for some saving! Similarly, carbon moves into and out of the atmosphere.
You can think of the atmosphere as a carbon account. Start accounting for the effect of living things on carbon with the following steps. Do the first two steps below as a class, and then continue on your own with the Carbon Flux interactive.
- Review the animation you saw in step 9 of Lesson 2.1. As you watch, note the CO2 level in air in the Northern Hemisphere throughout the year. What pattern do you see?
- Copy the table below to your science notebook. Think about the rates of photosynthesis and respiration in different seasons, and then enter "high," "middle," or "low" in each of table cells.
- Next, use the Carbon Flux interactive to model carbon flow. Open the interactive, and read the following summary:
The x-axis shows two seasons: winter and summer. For either, you can increase or decrease the rate of respiration (red) or photosynthesis (green). Respiration is a source of CO2 to the atmosphere. In other words, respiration adds CO2 to the atmosphere. Photosynthesis removes CO2; therefore, relative to the atmosphere, plants are a sink for CO2. The plants can be in the ocean or on land. The net flow for a season is blue. The net flow for the whole year is the gold bar. - In the table, a team of students has decided on the values for photosynthesis and respiration where they live. Did they balance the system? You and a partner can help. Use the Carbon Flux interactive as you complete these steps to determine if the students balanced the system.
Winter Summer Respiration (R) 1.5 3.25 Photosynthesis (P) ‐0.25 ‐3.0 - Open the interactive and enter the values for photosynthesis and respiration from the table above.
- For a balanced system, the net flow of CO2 in the atmosphere is zero. This is shown by adding the value of the two blue bars together. Explain whether the system is balanced. Beside the blue bars, the gold bar ("seasonal difference") gives another way to test for CO2 balance.
If carbon is going to the atmosphere, the gold bar is positive.
If carbon is leaving the atmosphere, the gold bar is negative. - There are several ways to change values in the model so that the net flow is zero. Explore these with a partner and record your values in your notebook. The students noticed that they could balance the system with respiration in the winter equal to zero (R=0). Test this solution. Explain whether this is a reasonable solution.
- During winter, ecosystems in some cold regions have photosynthesis of zero (P=0). Respiration is small, but still above zero (R>0). However, the net flow of CO2 all year is zero.
- What does this tell you about the rates of photosynthesis and respiration in the summer? Select a set of values with the model to demonstrate your thinking.
- Record the values you used to test this situation.
- In the tropics, plants grow quickly all year. However, drought years have much less rainfall than average. Plants grow much less, or even die, under drought stress. At the same time, total respiration can increase due to decay of dead plants by decomposers and bacteria. This happened in 2005 and 2010 in the Amazon Basin.
- What would be the net flow of carbon for the atmosphere during a drought year?
- Use the Carbon Flux interactive to show what photosynthesis and respiration might look like in a drought year. Capture the image or sketch it in your science notebook.
| Winter | Summer | |
|---|---|---|
| Respiration (R) | ||
| Photosynthesis (P) |
B. Hawaiian P & R
Mauna Loa is a volcano on the Big Island of Hawaii. In Lesson 2.2, you started learning about CO2 measurements there. At nearly 14,000 feet (about 4,200 m), it rises into the atmosphere near the middle of the Pacific Ocean. Besides telescopes for astronomy, Mauna Loa is home to a research station that has measured CO2 in the atmosphere for more than 50 years. These data are like the CO2 data from air bubbles in the Antarctic ice core in Unit 1. An important difference is that Mauna Loa has recorded values for each month.
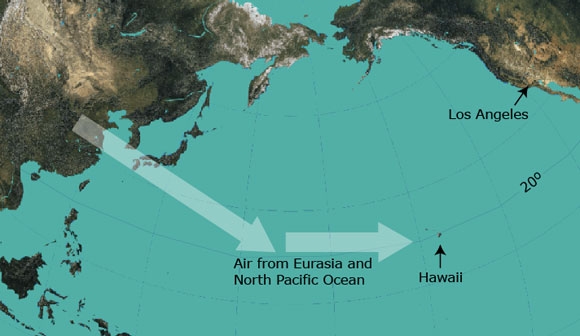
Recall that air arriving at Mauna Loa has crossed the Pacific Ocean. Scientists can trace the path of the air through Europe and Asia. Air travels to Mauna Loa from these regions in a few weeks. When that air arrives, the CO2 signal is a record of photosynthesis (P) and respiration (R) from wherever the air has been—mid‐latitudes in the Northern Hemisphere.
In the following steps, you will use a model to simulate changes in CO2 in the air from photosynthesis and respiration. Using models like this helps scientists better understand carbon sources and sinks in the carbon cycle.
- Get a printout of the graph. It shows a simulation of changes in CO2 at Mauna Loa from 2004 to 2010. The pattern is only due to photosynthesis and respiration. You can infer the amount of P versus R for air arriving to Mauna Loa. The human effect is not yet included in the model. You will get that at the end of the lesson.
- Look at the x-axis. Label some data points with months for a year. How does CO2 change over a year from January to December?
- In what season, or months, is the net flow of CO2 to the atmosphere positive, or increasing? What does this tell you about P versus R?
- In what season, or months, is the net flow of CO2 to the atmosphere negative, or decreasing? What does this tell you about P versus R?
- In what months are P and R the closest to being balanced (that is, net flow ≈ 0)?
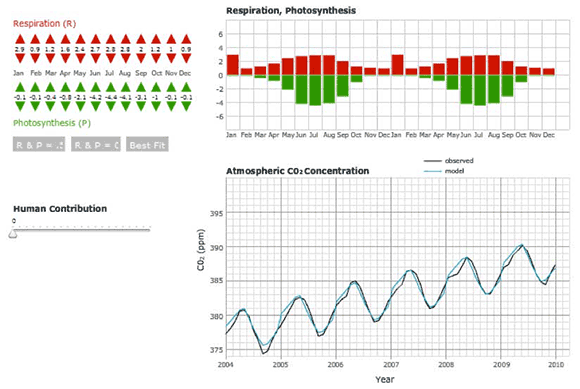
- You will now simulate the relative rates of photosynthesis and respiration for air coming to Mauna Loa. Open the Mauna Loa Biosphere interactive, and read this summary:
Along the x-axis are months for two years. For any month, you can increase or decrease respiration (red) or photosynthesis (green). If you change a value in one month, it changes the value for that month in both years. The modeled amounts are graphed in the upper-right. In the lower-right, the modeled CO2 is in blue, and the "observed," or actual record is in black. It is an annual mean by month from 2004-2010. The net flow of CO2 for the atmosphere is by month in the lower-left. - A team of biologists has been working on the CO2 record from Mauna Loa. They have measured respiration values by month (see table). Complete the following steps to simulate with the model the levels of photosynthesis for each month:
| Jan | Feb | Mar | Apr | May | Jun | Jul | Aug | Sep | Oct | Nov | Dec |
|---|---|---|---|---|---|---|---|---|---|---|---|
| 0.9 | 0.9 | 1.2 | 1.6 | 2.4 | 2.7 | 2.8 | 2.8 | 2 | 1.2 | 1 | 0.9 |
- Add the respiration values to the model for the first six months (January to June).
- Adjust photosynthesis for the first six months to match the CO2 data. Get as close a fit (highs and lows) as you can.
- For the remaining months, do them two months at a time. Add two respiration values, and then adjust the photosynthesis values.
- Record your values for each month when you have a fit that is reasonably good.
- Use these steps to examine your results with a partner:
- What is the pattern for respiration during the year?
- What is the pattern of photosynthesis during the year? How does this compare with the pattern for respiration?
- In what months is the net flow of carbon into the atmosphere? In what months is the net flow of carbon out of the atmosphere?
- Using the model, can you match CO2 patterns in the atmosphere if respiration is zero for a month? You can test this by selecting a month and setting respiration to zero.
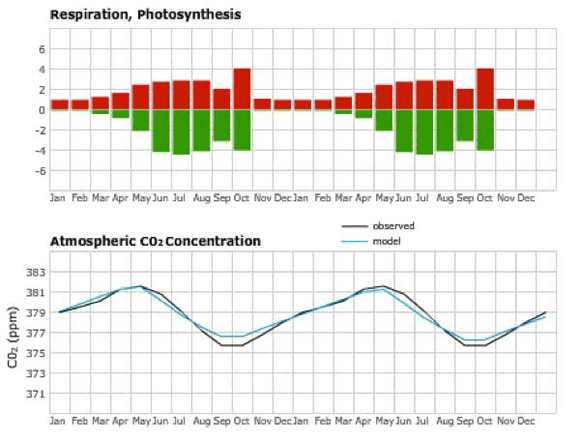
- A research group found a good match with the model (blue) and the observed data (black). This is in the following graph. Critically evaluate the pattern for P and R values and seasonal patterns that you would expect in the biosphere. Explain whether you would accept the model results of this research group.
C. The Human Effect
In section B, the data were only for changes in CO2 from natural processes: photosynthesis and respiration. The trade-off between these makes it look like the biosphere is "breathing" each year.
What other factors affect the CO2 in your air? From the title of this section, it comes from human activities. The graph shows the actual CO2 data measured at Mauna Loa for the period 2004-2010. The total curve has natural and human effects. By comparing the two graphs, you can see the difference by adding the contribution by human activities.
Analyze these data further in the steps below.
- Look at the CO2 data in the graph from Mauna Loa (1958-2010). Complete these sentences about those data.
A pattern I see in the graph is _____________________.
The levels of CO2 have changed from about _____________________ ppm in 1960 to about _____________________ ppm in 2010.
These changes show an overall trend for CO2 that is _____________________. - Open the second Mauna Loa CO2 interactive. This version lets you include the human effect.
- A research team has suggested rates of P & R for air arriving at Mauna Loa. Get their data in the interactive by clicking "best fit." You can also return to values for P & R of 0.0 or 0.5.
- You can adjust the human effect with the slider. The values on the slider show the rate of change in CO2 (in ppm) because of humans. Which value best matches the data?
- How do you adjust values to see only the human effect? In other words, what would you do to turn off the "breathing biosphere"?
- Say that the human rate of CO2 input increased from 1.955 to 2.542. You wish to model how to counteract that increase. Would you do that by changing photosynthesis, respiration, or both in the model? Write your thinking in your notebook.
If you are unable to see the interactive, click here to open it in a new tab.
D. Reflect and Connect
Complete Lesson 2.3 with the following questions.
- You can match the CO2 levels from Mauna Loa with the human contribution at zero. This is shown in the Mauna Loa Biosphere interactive. Do you think that this represents proper use of scientific models?
- Human use of fossil fuels is part of the carbon cycle. Are these fossil fuels a source or a sink of CO2 to the atmosphere? Make a diagram in your science notebook to show your answer.
- A geoscientist is trying to analyze some data that shows CO2 levels in the atmosphere. The original scientists that recorded the data got a little sloppy and forgot to record the area they were monitoring. The geoscientist knows the data were from either Argentina or Germany, but he is not sure. Use your understanding of processes in the carbon cycle to help the geoscientist figure out the location of these data. Once you have identified the country, describe why you think the data is from that location.
Hint: You may need to check a globe to see where Argentina or Germany are located.
- You can match the CO2 levels from Mauna Loa with the human contribution at zero. This is shown on the graph. Do you think that this represents proper use of scientific models?
Explore More: The Green Machine
The Green Machine
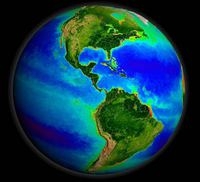
Earth is quite a sight from space. A main feature you see is oceans, as about 70 percent of Earth's surface is covered in oceans. You also see a lot of clouds. Between the clouds and oceans, you can see some areas of green and tan. The green regions have many plants and other photosynthesizing organisms.
But you've also seen that a lot of photosynthesis and respiration also occurs in the oceans. In fact, about one-third (33 percent) of photosynthesis occurs in oceans. Even though the oceans look blue, they harbor lots of photosynthesizing organisms. These producers are the base of the marine food web. Thus, in considering both land and oceans, Earth is a "Green Machine."
Listen to your teacher for directions on watching The Green Machine video. You may have time to view it at the end of class, or on your own. In Lesson 2.4, you will think more about how humans affect the green machine.