


Unit 2: Carbon Now
2.5: Earth Takes a Breath
FOCUS QUESTION:
How do carbon dioxide (CO2) records at the poles of Earth reflect the carbon cycle in the biosphere?
Introduction
In this unit, you have really engaged in the carbon cycle. After the aquarium experiment (Lesson 2.2), you are now thinking about carbon moving in systems around Earth. That's global thinking!
You have looked at sources and sinks of carbon on land and in the oceans. Photosynthesis and respiration move that carbon among reservoirs continually. Moreover, several factors either increased or decreased the rate of these processes.
In this lesson, you get to show what you have learned about carbon cycling. You have studied some records of CO2 in the atmosphere, such as at Mauna Loa. What do the data look like at other latitudes, such as at the poles? To do this, you will investigate data from the South Pole and very near the North Pole. You will learn:
- Factors that affect the rates of photosynthesis and respiration (e.g., seasonal sunlight) also affect the rate that carbon moves in the biosphere and geosphere.
- Processes that cycle carbon act at different scales in the Earth system.
- Fossil fuels supply most of the energy needs for the United States and other countries.
Remember to use the focus question to guide your learning in this lesson.
A. Key Things You Learned
Before you start your activity, review some ideas you have learned in Unit 2.
Lesson 2.1
- Different processes move carbon among different parts of the Earth system.
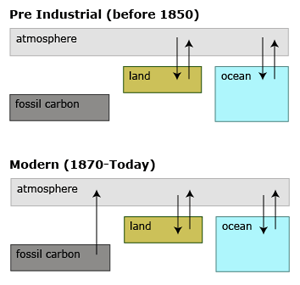
- You can use a box diagram to model how carbon moves in the Earth system.
- Carbon transfer in the Earth system involves organisms in the biosphere.
- Humans use a variety of technologies to monitor carbon moving in the Earth system.
Lesson 2.2
- Photosynthesis and respiration move CO2 into and out of the biosphere.
- We can use of scale models to understand larger-scale processes on Earth.
- Different factors, such as patterns of light, affect the rate of photosynthesis and respiration.
Lesson 2.3
- Photosynthesis and respiration are two important processes that help in understanding the patterns of CO2 in the atmosphere.
- CO2 in the atmosphere has a trend that is steadily rising because of human activities and the use of fossil fuels.
- Scientific models and simulations help you understand the transfer of carbon by different processes in the Earth system.
Lesson 2.4
- Fossil fuels consist of carbon from the past that has been stored in the geosphere and is used by humans.
- Forests and oceans can take up only some of the fossil carbon (about 50 percent) that is added back into the Earth system by humans.
- Fossil fuels are a key part of generating electrical energy for use by humans.
B. Comparing Scales
In Lesson 2.2, a high school class made measurements in an aquarium with aquatic plants. These connected to rates of photosynthesis and respiration depending on whether it was day or night. During photosynthesis, carbon dioxide is taken in and oxygen is released. Recall the reaction:
6CO2 + 6H2O + Energy → C6H12O6 + 6O2
During respiration, the reverse is true:
C6H12O6 + 6O2 → 6CO2 + 6H2O + Energy for the organism
Get with a partner to answer the questions below. You will compare CO2 data in two graphs. One graph represents carbon dioxide (CO2) in the water for an aquarium that contains an aquatic plant. It is by a window. The other is for CO2 levels in air at Mauna Loa. This is a good way to show your understanding of how carbon cycling acts at very different sizes.
- Get a handout from your teacher of these two graphs. Your teacher may have you hand it in with your answers to the following questions.
- The x-axes have no labels. Add labels to the diagram below.
- For the aquarium data, decide with your partner which part(s) of the CO2 curve would be night and which would be day. Draw vertical lines between day and night corresponding to sunrise and sunset.
- For the Mauna Loa data, show your estimates for what part(s) of the CO2 curve correspond to each of the four seasons. Label the seasons on the curve.
- On each graph, identify places where the rate of respiration equals the rate of photosynthesis.
C. Energy for Humans
You are part of the carbon cycle in several ways. One way is by using electrical energy. Answer the following questions about how carbon released by humans becomes part of the biosphere.
- When humans use fossil fuels to generate energy, about 25 percent of the CO2 emitted is taken up by the oceans. Another 25 percent is taken up by land plants.
- What happens to the remaining 50 percent of CO2 emitted when using fossil fuels? Use evidence from your chapter to support your answer.
- Are soils able to take up part of the CO2 in the atmosphere? In other words, would you expect that soils are a source or sink of carbon for the atmosphere?
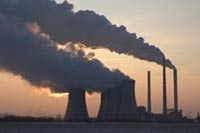
- Most of the electricity for humans comes from the combustion of fossil fuels at power plants. For example, supporting 75 homes in Denver for one day requires about 1,235 kilograms of coal. That coal gives off about 1,872 kg of CO2. This is shown in the diagram below. Get with a partner and answer the questions that follow about this process.
- You can compare this process with carbon reactions in the biosphere. Does this process seem more similar to photosynthesis or to cellular respiration? Give one reason why.
Hint: It may help you to review those reactions in the section above. - Coal is a hydrocarbon. Based on your answer in step a, what would you predict happens to the hydrogen in coal?
- On land, the CO2 could be taken up by a plant or tree. If the CO2 entered the ocean, what is a carbon-bearing substance that the carbon atom could become a part of?
- You can compare this process with carbon reactions in the biosphere. Does this process seem more similar to photosynthesis or to cellular respiration? Give one reason why.
D. Field Trip 1: Point Barrow, Alaska
You have taken some field trips in Carbon Connections. This is fun, as you might not ever visit some of these places. The introduction to this lesson talked about going to the poles. This helps you understand the carbon cycle at different places on Earth. Let's travel to one now—Point Barrow, Alaska!
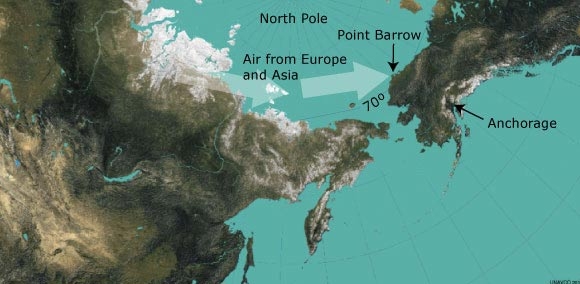
Point Barrow is the northernmost point in the United States. It lies on a point of land protruding out into the Arctic Ocean. It is above the Arctic Circle, so in the middle of winter it is dark for 24 hours; in summer, it is light for 24 hours.
Like Mauna Loa, Point Barrow has a climate station. It regularly measures CO2 levels of the air. These are reported as monthly averages. The ecosystem, or biome, at Point Barrow is Arctic tundra, yet the air arriving to the station has had a long journey around the Arctic. Before arriving at Point Barrow, much of the air has been interacting with boreal forests and tundra in northern Europe and Siberia (see map).
Examine with a partner the CO2 record from Point Barrow in the steps below. The most recent data extends to the start of 2008.
- Get from your teacher a handout of CO2 data for Point Barrow (2002-2008). Select a calendar year and label the months. Use these labels as a reference for other years as you do the next steps.
- In what time of the year is the amount of CO2 the highest?
- In what time of the year is the amount of CO2 the lowest?
- Look at when the CO2 levels are decreasing. What process(es) in the biosphere could explain that decrease?
- Look at when the CO2 levels are increasing. What process(es) in the biosphere could explain that decrease?
- Look at the combined CO2 data for 2002-2008 from Mauna Loa and Point Barrow. Compare these data in the following steps.
- Write one way they are similar.
- Write one way that they are different.
- Write two sentences about this graph using the phrases "rate of photosynthesis," and "rate of respiration."
- Here's another graph of combined CO2 data for 1980-2010 for Mauna Loa and Point Barrow. Assuming that nothing changes in the next 10 years, make a prediction for levels of CO2 at 2020.
E. Field Trip 2: South Pole, Antarctica
Don't put your coat away! For second field trip, you are going to the South Pole.
The South Pole is at the center of the continent of Antarctica. Most of Antarctica is covered by an ice sheet nearly two miles thick at some locations. Rugged mountains extend high above the ice sheet in spots, giving clues to Antarctic's geologic past. Some of these rocks contain dinosaur bones, indicating that Antarctica was not always so cold.
You saw an ice core record from Antarctica in Unit 1. Another important record of Antarctica's climate comes from a climate station on top of the ice at the South Pole. Most of Antarctica is surrounded by ocean (map). Winds circling Antarctica mix air that is interacting with the oceans and land. Both the land and ocean have seasons when productivity is high, and when it is low. That air also arrives at the climate station at the South Pole.
Investigate part of the CO2 record from the South Pole in the steps below. The most recent data extends to the start of 2006, so you will look again at a six-year period (2000-2006).
- Get from your teacher a handout of CO2 data for the South Pole and Mauna Loa (2000-2006). Select a calendar year and label the months. Use these labels as a reference for other years as you do the steps below.
- Write one way they are similar.
- Write one way that they are different.
- Write two sentences about this graph using the phrases "rate of photosynthesis," and "rate of respiration."
- What is the main difference you see between a hemisphere dominated by land, and a hemisphere dominated by ocean?
By looking at a selection of CO2 data from air in Unit 2, you started to see patterns and trends. These patterns and trends are related to interactions among parts of the carbon cycle in Earth's system. Having distinct patterns and trends offer scientists something else when working to understand the carbon cycle and climate. The patterns help them develop models of the systems. With those models, scientists can test explanations for how carbon cycles.
Listen to your teacher for when you will start Unit 3 of Carbon Connections. In that unit, you will get to try your hand at a climate model with several factors. Several of those factors relate to the carbon cycle. Using the model, you will get to investigate why that is!