


Unit 1: Carbon & Climate in the Past
1.2: Carbon from the Past
FOCUS QUESTION:
What is the pattern for carbon dioxide (CO2) and temperature in Earth's past?
Introduction
In Lesson 1.1, you saw that CO2 can enter and exit water. The activities were a good model for carbon moving between the ocean and air in the carbon cycle. Now think about the geologic past. Do you think there were times when more CO2 was leaving than entering the ocean, or vice versa? How might you, or a geoscientist, be able to investigate CO2 in Earth's past? This is an important question. Perhaps you've heard that the temperature of the atmosphere is related to CO2 contents of the air.
Think of the atmosphere as a key part of the Earth system. If CO2 is leaving the oceans, it is probably moving to the atmosphere. Or, if CO2 is entering the ocean, it is probably coming from the atmosphere. So, how could you get samples of that prehistoric air?
You're in luck. Geoscientists have a clever way to get tiny samples of "old" air. Can you think of a natural material on Earth that captures a small sample of air as it forms? It is not obvious, but there is an earth material that does this: Snow!
In this lesson you will see that:
- Ice sheets preserve tiny samples of ancient air from Earth's past.
- Samples of air from ice cores show the relationship between the CO2 levels and temperature for climate in Earth's past.
Later in Carbon Connections, you will return to see how these concepts closely connect to the carbon cycle. In this lesson, you will focus on understanding this question better.
A. Ice Cores—CO2 Records
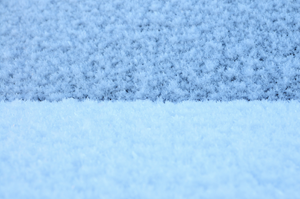
Think about how snow might trap air. When snow falls, the flakes stack up. Between stacked flakes, tiny pockets of air get trapped. It's like the model with cereal flakes that your teacher showed you. If that snow melts, the air is released back into the atmosphere. For example, this happens each spring in cities and towns across the U.S., such Denver, Chicago, New York, or Boston, or maybe in your own town. No air inside the snow is preserved because it's melted.
Other places on Earth are cold all year. The snow does not melt, it piles up, layer upon layer. The best examples are near Earth's poles, such as on the ice sheets of Greenland or Antarctica. There, the temperature is almost always below freezing. As snow gets deeper, it hardens into glacial ice and preserves small pockets of air from the time when the snow fell. Deeper in the snowpack, the pockets of air contain older air. View the Air Between Flakes video to see how air gets preserved in snow.
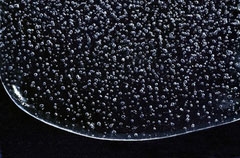
The air bubbles image to the right shows what ice looks like deep in an ice sheet. Under the increased weight of overlying snow and ice, a layer progressively changes from packed snow to ice. The largest ice sheets today are on Antarctica and Greenland. The layers in these ice sheets are of particular interest to geologists who study Earth's past climate. Part of understanding climate is retrieving and analyzing the CO2 in those trapped air bubbles.
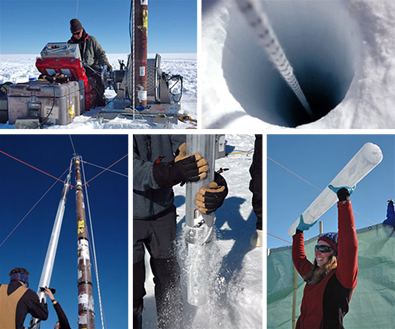
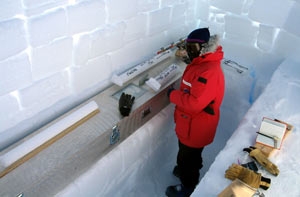
How can you measure CO2 contents of air in the past? To do this, geologists drill a core into the ice sheet; the deeper they drill, the older the ice. The Young Ice, Old Ice animation shows how geologists get an ice core. The bubbles in that old ice have samples of old air. Then, the scientists measure the CO2 content in the bubbles from different depths.
Young Ice, Old Ice
Carbon Dioxide Concentrations, Antarctica
The graph below shows the CO2 levels in the air bubbles of an ice core from Antarctica. The age of the ice (x-axis) as you go down the core goes from recent times (about 1,000 years ago) back to 650,000 years ago. It may not seem like 1,000 years ago is "recent," but this is only a small fraction of 650,000 years. On that scale it is relatively recent. The core penetrates more than three kilometers (nearly two miles) into the ice sheet. This distance is like going around your school track nearly eight times. That's deep! It takes many years to drill and recover a core like this.
The y-axis on the graph shows the CO2 levels in air when the snow fell. The units are in parts per million (ppm) of CO2. You can think of parts per million like this: Think about visiting a large city like Dallas, Texas, which has a population of about one million people. As one person in a million people, you would represent one part per million.
Explore this graph further while answering questions about CO2 levels in the atmosphere in Earth's past. Record your answers in your science notebook.
- What are the highest levels of CO2 in the atmosphere in the past 650,000 years? Be specific about the five or six times when CO2 levels were the highest. When were these?
- What are the lowest levels of CO2 in air in the past 650,000 years? When were five or six times with relatively low CO2 levels in the air?
- Do you see patterns in the data? If so, how would you describe them?
Hint: In other words, how often do peaks and valleys occur? - Answer these two questions about changes of CO2 levels in the air:
- When CO2 increased in the air, from where do you think it was coming?
- When CO2 decreased in the air, where do you think it went?
So, why would geologists study the CO2 levels in the atmosphere? Maybe you have heard that CO2 levels in the atmosphere are related to Earth's climate. The ice core that you just explored also contains evidence for the climate and air temperature at the time the snow was falling. Using data from this ice core, continue with the next section to explore whether the air temperature at Antarctica is related to CO2 levels in the atmosphere.
B. Ice Cores—Temperature Records
Scientists have a detailed record of air temperatures above the ice sheet from the past. Levels of CO2 come from the bubble, but temperature is measured from the ice (H2O) immediately around the bubble. This is possible because the chemistry of ice differs very slightly depending on the average air temperature.
Temperature Variations, Antarctica
The Temperature Variation graph shows temperature changes for air above the Antarctic ice sheet. As with the CO2 graph, the age of the ice (x-axis) goes from recent times (about 1,000 years ago) to 650,000 years ago. The y-axis shows how average air temperature above the ice sheet has changed during that time. Even though Antarctica is always cold, the data show that the average temperature has varied. In this graph, the value of 0°C is the mean value for the past 1,000 years. Along the length of the core, temperature values are either below or slightly above that value. Explore temperature changes further in the questions below.
- Answer these questions about air temperatures in the past at Antarctica. Note that "recent" is not quite today on this timeline, but about 1,000 years ago, before the Industrial Revolution.
- Was the past warmer or colder than recent times? Recall that recent times are on the line at 0°C on the y-axis.
- Which times were warmer than recent times?
- How do patterns in CO2 levels compare with the temperature record? Use this sentence starter to frame your observation:
For times when the CO2 record was increasing, I see that the temperature record _____________________.
For times when the CO2 record was at a low point or valley, I see that the temperature record _____________________. - Complete the following steps about glacial and interglacial climate periods on Earth using a handout of the CO2 or temperature graph.
- Read the Antarctica Ice Sheet graph.
You may have learned that during certain times in Earth's past, large areas of the continents were covered with large sheets of ice. The overall temperature for Earth's climate at those times was relatively cold. These time periods are called glacial periods, or ice ages. In contrast, interglacial periods are the relatively warm climates for Earth between glacial periods. This does not mean that there were no ice sheets; the ice sheets were just much smaller and restricted to regions at or close to the poles. - About how many glacial periods do you see the past 650,000 years? Label these on your graph using a circle or arrow. (You can also list ages where glacial periods occurred.)
- About how many interglacial periods do you see the past 650,000 years? Label these on your graph using a circle or arrow. (You can also list ages where interglacials occurred.)
- Complete this sentence in your notes:
Currently, the climate of Earth matches a(n) _____________________ period. - Watch the Glacial/Interglacial Cycle video to view past changes between glacial and interglacial periods.
- Read the Antarctica Ice Sheet graph.
- You can show both CO2 levels and temperature variation in the same graph. An example is the Antarctica Ice Sheet graph. It helps you compare the two variables together. You can show both CO2 levels and temperature from ice cores in a single graph. The Antarctica Ice Sheet graph is called a double-y graph. This is because it has two, dependent variables plotted separately on each of the y-axes. The left y-axis shows CO2 levels (units of ppm CO2), and the right y-axis shows temperature variation (°C). The independent variable of Age of Ice (x-axis) is the same for both of the dependent variables (y-axis).
- Show the relationship between variation in CO2 level and temperature in the CO2 Temperature Relationship graph. You can plot actual values for data from the ice core, or just estimate the trend.
Hint: The axes in the CO2 Temperature Relationship are for temperature at Antarctica (y-axis) with CO2 levels in the atmosphere (x-axis). Select four or five points from the Antarctica Ice Sheet graph with low, middle, and high values of CO2. Find the corresponding temperature for those CO2 values and plot those points on the graph below. - As your teacher directs, watch the next video, "How Do We Know?". It will tell a little more about measuring past climates from ice cores.

Explore More: Carbon Cycle Connections
Carbon Cycle Connections
In Lesson 1.1, you investigated carbon as CO2, moving in and out of water. In this lesson, you saw how CO2 levels have changed in Earth's past in the atmosphere. For a period where CO2 is increasing in the air, does the CO2 just come from the oceans? What changes might be occurring on land?
Maybe you have explored photosynthesis in your science class. Photosynthesis is the process where plants and other CO2 producers use water (H2O), carbon dioxide (CO2), and energy from the sun to produce organic molecules (e.g., C3H6O3) and oxygen (O2). This process moves carbon from the atmosphere (in CO2) to living organisms.
You saw from the Antarctica ice core that there are times when CO2 was decreasing in the atmosphere. Perhaps producers account for these dramatic changes in CO2 in the air. Recall that primary producers, or autotrophs, include a variety of plants, algae, and bacteria in food webs. Photosynthesis moves carbon from the atmosphere to the oceans or land. The photosynthesis reaction is:
3CO2 + 3H2O + energy → C3H6O3 + 3O2
carbon dioxide + water + energy → organic molecules + oxygen
Explore how carbon on the land changes as carbon in the atmosphere changes by looking at ecosystems in the past. Changes between glacial and interglacial periods is a good timeframe to compare. Do the following steps to investigate further carbon cycling in Earth's past.
- Antarctica CO2 and temperature data is shown in the CO2 and Temperature Data graph. This shows the record of CO2 and temperature going back to 150,000 years; the Antarctica Ice Sheet graph you looked at went back to 650,000 years ago. Two highlighted regions of the curve are at 20,000 years ago and recent times. (Recall that "recent" is not today on this timeline, but about 1,000 years ago, before the Industrial Revolution.)
- What was the CO2 level 20,000 years ago? Was temperature relatively warm or cool?
- What is the CO2 level at recent times? Have CO2 levels increased or decreased from 20,000 years ago?
- Consider 20,000 years ago and recent times. Do these times correspond to glacial or interglacial periods?
- You've looked at records of carbon as CO2 in the air. Combine this with the relative amounts of carbon stored on land. Land carbon includes all soils and vegetation. The Present Potential Vegetation map shows a time before modern agriculture, about 1,000 years ago. For this time, areas with closed forests are in green (more than 70 percent coverage by trees). Areas of extreme desert are in yellow (less than 2 percent vegetation cover).
- What are the three or four regions on Earth with the most vegetation?
- How do you think that the amount of vegetation relates to soils and the carbon on land?
- Using the graphs, were CO2 levels in the atmosphere at this time high or low?
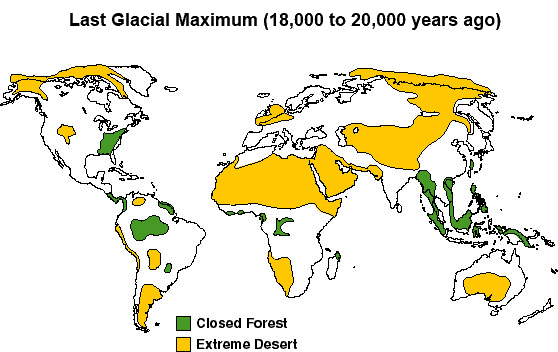
- Now look at the Last Glacial Maximum map of ecosystems at about 20,000 years ago. This was the last Ice Age, when large ice sheets covered much of North America, northern Europe, and Asia. Sometimes this is also called the Last Glacial Maximum (LGM). Compared with the previous map, the color key is the same (closed forest, green; extreme desert, yellow), but the patterns are very different. It is estimated that less than five percent of land has coverage from trees and forests. Extreme deserts are widespread.
- How do you think that the carbon in soils of deserts compares with the carbon in soils of forests?
- Using the graphs, what were CO2 levels in the atmosphere at this time?
- Watch the video, "Glacial/Interglacial Cycle," which shows the location and size of ice sheets during glacial and interglacial periods. Look at how the ice sheets cover large areas of land with soils and forest in more recent times.
- Use the CO2 and temperature graphs to infer which map would most likely apply to 125,000 years ago. Check your thinking with a classmate.
| Factor | Does the factor increase (↑) or decrease (↓) from 20,000 years ago to today? | Does the factor increase (↑) or decrease (↓) from 125,000 to 20,000? |
|---|---|---|
| carbon in atmosphere (as CO2) | ||
| average temperature over Antarctica | ||
| mean temperature in North America and Eurasia | ||
| amount of vegetation on land | ||
| amount of carbon on land |
- Explore the time from the last glacial maximum 20,000 years ago to recent times. This is the first column in the Factor table. Use the Factor table to help you organize your thinking. Use arrows in the boxes to show an increase (↑) or decrease (↓) for the period.
- Over that period, did the amount of CO2 in the atmosphere increase or decrease?
Hint: If you are not sure, return to check the CO2 Temperature Data graph above for CO2 levels. - Over that period, did the carbon on land (soils, vegetation) increase or decrease?
- How does the change in CO2 level and carbon in ecosystems compare with the climate and temperature in Antarctica? For relative amount of carbon, use words like "high" or "low."
- How can you explain the changes you see for carbon in land and CO2 in atmosphere?
- Over that period, did the amount of CO2 in the atmosphere increase or decrease?
- Investigate the period from about 125,000 years ago to the last glacial maximum at 20,000 years ago. This is the second column in the Factor table. Use arrows in the boxes to show an increase (↑) or decrease (↓) for the period.
- Over that period, did the amount of CO2 in the atmosphere increase or decrease?
- Over that period, did the carbon on land (soils, vegetation) increase or decrease?
Hint: Recall what you inferred about the ecosystems at 125,000 years ago in 3d above. - How does the change in CO2 level and carbon in ecosystems compare with the climate and temperature in Antarctica? For relative amount of carbon, use words like "high" or "low."
- If CO2 is decreasing in the atmosphere, and carbon as vegetation is decreasing on land, think about where that carbon might go, using these steps.
- What is a part of Earth that could accept, or "soak-up," some of that carbon?
- What investigation did you do that would help you understand where that carbon could go?
- Using data from graphs in the lesson, identify some periods when carbon was decreasing in the atmosphere.
C. Reflect and Connect
Summarize your ideas for Lesson 1.2, using the figures in the lesson to help you. If helpful, work with a partner; he or she might have some ideas to help you get the big picture.
- Return to answer your focus question for Lesson 1.2: Return to answer your focus question for Lesson 1.2: What is the pattern for carbon dioxide (CO2) and temperature in Earth's past?
- Make a sketch in your notebook of a diagram that shows a carbon atom moving from the ocean to a tree near your home. What different forms does the carbon atom take en route?