


Unit 1: Carbon & Climate in the Past
1.3: Carbon Forcing
FOCUS QUESTION:
What gases in the atmosphere connect to Earth's temperature and climate?
Introduction
In Lesson 1.2, you saw the relationship between changes in CO2 levels in Earth's atmosphere and temperature variations at Antarctica. The two variables increased and decreased together. You saw that the timing of those changes matched some other changes on Earth, such as the growth and decay of large ice sheets.
But from these changes, can you tell what factor actually caused the change in the system? Understanding the cause of changes in systems is part of answering basic scientific questions. However, those causes are not always obvious. In this lesson, you will start to see how scientists combine measurements with models to better understand factors that may affect Earth's climate. In particular, you will learn that:
- Forcings lead to responses or changes in systems.
- Forcings in the Earth system can cause Earth's climate to change.
- Greenhouse gases affect the temperature of Earth's atmosphere.
- Models and simulations can help you understand forcings in Earth's climate system.
A. A Forcing Brainstorm
You've probably been "forced" to do a task by your parent or older sister: maybe it was homework, chores, practicing sports, or riding in the middle seat of the car. When you are forced to do something, it causes a certain outcome, or response, even if it is not right away.
For step 1, get together with two partners for 2 to 3 minutes. Think creatively about examples from your home, school, or community to include in the Force/Response table. Get ready to share your best ideas with the class. The table has an example to get you started.
- Review the three important words in the header of the table. Copy the table into your science notebook. Add your own examples to the table that you and your partners think of.
Forcing: A forcing is any event or thing that causes or leads to change.
Response: The response is the result or change from the forcing.
Lag: The lag is how long after the forcing that the response starts to occur.
| Forcing | Response | Lag |
|---|---|---|
| Mom tells me, "Clean your room!" | I clean my room. | I do it 3 days later. |
| Add your own examples here… |
B. Forcings in Systems
Earth's climate also responds to forcings. As you just saw, a forcing is an input that causes a change in a system. From the forcing, the system has a response, or an output. Think of heating a kettle of water on the stove, as in the figure. The input, or forcing, is thermal energy from the stove. The top graph shows when the stove is on or off. The response, or output, is the temperature changes in the water in the kettle. The lag is the time it takes for the response to occur. For this system, the response builds over time. Thus, the lag is not the time for the total response to occur. Here, the full response would be a kettle with boiling water.
Answer the following questions about the forcings, responses, and lags in systems.
- Compare the shape of the two Response graphs. How does the change in the setting of the knob for the stove compare with the change in water temperature?
- Imagine a rock in the desert sitting all day in the summer sun. After sunset, how long do you think it might take to cool to the temperature of the night air? Use the example of the tea kettle to draw your answer with two graphs that show:
- The amount of sunlight on the rock (y-axis) as the sun sets and it becomes night (x-axis)
- The relative temperature of the rock (y-axis) as the sun sets and it becomes night (x-axis)
- Look at an example of a forcing and the response in a seasonal climate. The Solar Radiation graph shows solar radiation coming to Denver, Colorado (green curve). The graph also shows the average temperatures by day. Answer the following questions to understand the relationship between solar radiation and temperature in Denver.
- What variable is on the x-axis? How long is the period shown?
- What variable is on the left y-axis? What is the range of values for this variable?
- What variable is on the right y-axis? What is the range of values for this variable?
- Complete these sentences about the graph:
The forcing in the system is ______________________.
The peaks and valleys for the forcing are in the months ______________________ and ______________________.
The response of the system is ______________________.
The peaks and valleys for the response are in the months ______________________ and ______________________. - Does the response occur right away, or after a lag? Use specific examples of dates and time in your answer.
Explore More: Correlations and Causes
Correlations and Causes
Think back to the CO2 and temperature data from Antarctica. These two variables increased and decreased together. When one variable changed, the other changed by a similar amount. You would say that these two variables correlate. A correlation is where two factors or variables increase or decrease together, both in direction and relative amount. It does not indicate why the factors changed, however; a cause tells you that. A cause is where one factor in a system forces one or more other variables to change.

Scientists need to carefully test both correlations and causes. This may seem obvious, but it is not always clear in Earth systems. This is because parts of the Earth system can change together (for example, atmosphere, oceans, biosphere, and geosphere). Think back to the correlation you saw in Lesson 1.2 between CO2 and temperature. This correlation does not necessarily mean that one caused the other. For example, something else might be making each of these two variables change. Scientists have to test for a cause, and they've done these tests. In laboratories, they have measured the kinds of radiation that CO2 and other gases of the air absorb. When the scientists begin the radiation, CO2 molecules in air absorb radiation. The temperature increases for that air. This is how they can test between correlations and causes with CO2.
Here is another example of cause and correlation. In North America in the fall, decreasing solar radiation and cold weather cause some trees to go dormant. Just before the trees drop their leaves, pigment changes in the leaves cause the leaves to change color. Similarly, the cold weather also reduces or eliminates food sources for some woodland birds. As a result, they migrate south to regions with more food. Therefore, leaves changing color correlates with fall migration; they don't happen together.
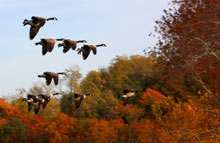
But is one of these a cause? It wouldn't make much sense to claim that migrating birds cause leaves to change color or drop. Leaves changing color wouldn't cause birds to migrate, even if it is an indicator to the birds that winter is coming. The change in seasonal climate and light cause several effects to occur together. Colder seasonal temperatures kill food sources for many birds. Separately, decreasing light causes and cold weather causes trees to lose leaves and go dormant.
Read the following examples. Discuss with a partner or your class which factors are causes, and which factors merely correlate. Write your ideas in your science notebook.
- You bought and downloaded four new songs. At the same time, the account balance on your music card went down, and you have less money to buy more songs.
- It was a good day for the stock market: Prices increased for shares in high-tech companies, as well as manufacturing. This occurred just after a positive report from the government about the amount of new jobs creation. Which change here could cause the other two to change?
- The physician observed these symptoms in the sick student: fever, runny nose, and aches and pains.
- The car passenger had several injuries from the accident: a broken humerus and collar bone, and a crushed foot.
C. Greenhouse Gases
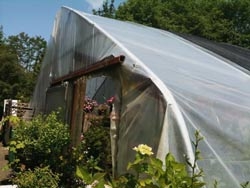
Maybe you have heard of the greenhouse effect. The greenhouse effect is the warming of Earth's atmosphere from the absorption of energy given off by Earth. That energy initially comes from heat from the Sun. The effect is similar to the warming in a greenhouse with a glass ceiling. Here is how this model works.
Sunlight shines in and warms the ground and plants in the greenhouse. The warmed ground and plants in turn warm the air immediately around them. Because the air is trapped in the greenhouse, the air is warmer than the air outside the greenhouse. The greenhouse is a pretty good model if you compare the warmed, trapped air in the greenhouse with all the warmed air of Earth's atmosphere. Without a ceiling, the warmed air in the greenhouse would rise and move away from the plants. Then you would not notice a difference compared with the air temperature outside. So, a limitation of the greenhouse model is that it does not quite work without a ceiling to hold in the warmed air.
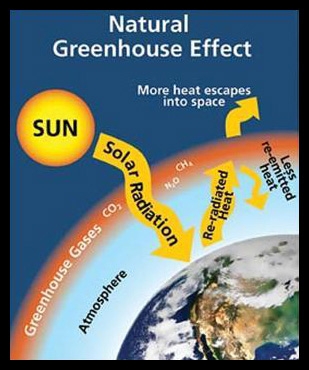
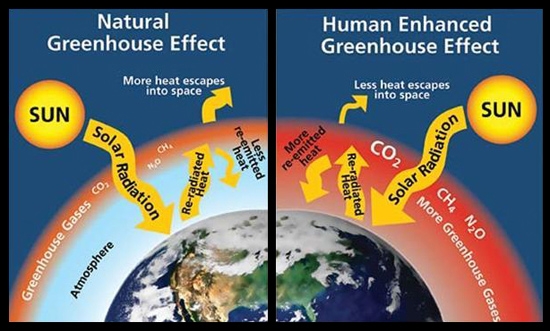
The greenhouse effect is vital for Earth, as represented in the diagram. Without a natural greenhouse effect, Earth's atmosphere would be about 33°C (60°F) colder and most of earth's water would be ice. Earth would be too cold for most plants and animals.
The greenhouse effect is caused by certain molecules in the atmosphere, called greenhouse gases, or GHGs for short. A greenhouse gas is a molecule that absorbs the energy given off by Earth's surface or by the atmosphere itself. That energy originally comes from solar radiation that enters the Earth system. The greenhouse gases cause the atmosphere to "trap" energy that would otherwise leave Earth and escape into space. Thus, greenhouse gases in the air are a forcing that leads to warming of the atmosphere and of the surface of Earth.
Greenhouse gases include water (H20), carbon dioxide (CO2), methane (CH4), nitrous oxide (N2O), and ozone (O3). Look at the atomic diagrams for these gases. They have a central atom about which the other atoms vibrate and rotate. In contrast, most of the atmosphere is nitrogen (N2) and oxygen (O2) gas. These gases do not have a central atom. They do not absorb energy given off by the Earth's surface or the atmosphere, so they do not contribute significantly to additional warming of the atmosphere.
Water (H2O) contributes the most of any greenhouse gas toward the greenhouse effect on Earth. It is found in the atmosphere as water vapor and as fine droplets in clouds. Scientists estimate that water as vapor and clouds lead to about 75 percent of greenhouse warming on Earth. Water vapor is part of the water cycle. When the water vapor in the air increases beyond 2 to 4 percent, the H2O condenses and leaves the air as precipitation. Thus, the H2O content of air does not increase beyond certain limits.
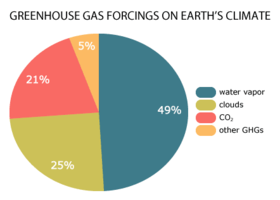
Carbon dioxide (CO2) is the second-most abundant greenhouse gas. Overall, CO2 contributes to about 20 percent of the total greenhouse warming on Earth. Yet, unlike H2O, humans are adding CO2 to air largely from the use of fossil fuels (such as coal, petroleum, and natural gas). Fossil fuels are the remains of plants and animals that existed millions of years ago. The carbon from these organisms was trapped in the Earth and, over time, became fossil fuels. Unlike H2O vapor, CO2 cannot just "rain" out of the sky when it gets to a certain level. The main way that CO2 can be removed from the atmosphere is through the carbon cycle. Currently, however, the carbon cycle can only remove about half of the CO2 added by humans. The result is that CO2 levels are increasing. You will investigate this further in Unit 2.
Other greenhouse gases lead to a small amount of warming, about 5 percent of the total. The graph above is a good way to show the total effect of greenhouse warming. Imagine a change that equals a temperature rise of about 1°C. Scientists have shown that the initial, direct warming from CO2 is about 0.2°C, with other minor GHGs contributing about 0.05°C. That total is about 0.25°C, or 25 percent, of the 1°C of warming. Water and clouds provide an additional warming of about 0.75°C, or about 75 percent of the 1°C.
To summarize, note a few things that are represented in the Greenhouse Effect diagrams:
- The natural greenhouse effect leads to an atmosphere that is warmer than it would be otherwise (left).
- The human-enhanced greenhouse effect results from the additional CO2 and other greenhouse gases added by humans (right).
- The same amount of solar energy enters the Earth system from the Sun, yet the extra greenhouse gases slow the transfer of energy from Earth back to space.
It can be difficult to understand how some gases in the atmosphere absorb energy, while other gases do not. To help you, your teacher will do a demonstration. The energy you will use is from a microwave. Microwaves produce radiation that you cannot see. This is similar to the type of energy that is radiated from Earth to the atmosphere.
- Your teacher will have two beakers (#1 and #2) with fluid at room temperature. Your teacher will put both beakers in the microwave, and turn it on for 20 seconds.
- Describe what happens in each beaker. Does the temperature of the beakers feel the same or different?
- For each beaker, which molecules in the atmosphere could it represent?
D. Climate Models
When scientists work to answer important questions, they like to gather different types of evidence. The different types of evidence are like different clues that a detective might use to solve a mystery. In a similar way, different approaches and lines of evidence have helped scientists understand the relationship between greenhouse gases and Earth's temperature. For example, one approach is to look at the geologic past and analyze the relationship between GHGs and temperatures. You did this in Unit 1 with CO2 and temperature from the Antarctica ice core. A second approach is to compare measurements of GHGs and temperature over decades. You will do this in Unit 3. Third, they can study other planets with greenhouse gas levels very different from Earth; for example, Venus is sweltering hot beneath thick layers of GHGs.
A fourth approach is to use computer models to test forcings and responses in systems. You will do this with a real climate model in this lesson. NASA scientists developed the CO2 Spike Experiment model to explore forcings and responses of Earth's climate. Models like this let you study real situations, or test what could happen if the system got pushed more than normal.
If you are unable to see the interactive, click here to open it in a new tab.
In particular, the CO2 Spike Experiment shows a "spike" of a sudden forcing. For example, what if the CO2 levels in the atmosphere suddenly increased from the low values of an ice age, to the high values of an interglacial period? This would be a spike in CO2 of the air from about 180 to 280 ppm. The Climate Model lets you model spikes that are more or less than this.
- View the results of the simulation with a partner and answer the following questions.
- What are the units for the x-axis?
- What year does the CO2 spike occur? For how many years does the simulation run?
- One responding curve is Earth's temperature. What color is it?
- Compared with the spike, describe the shape of the temperature response.
Hint: A way to describe it would be to estimate how long it takes to stop changing.
- Two other response curves are shown for ice cover of oceans and water vapor in the atmosphere.
- What color are these responding curves?
- After the CO2 spike, does ice cover increase or decrease? Does this match the result you observed from temperature?
- After the CO2 spike, does water vapor in the atmosphere increase or decrease?
- Scientists can also run simulations with negative spikes. Imagine a simulation with a spike from 280 to 180 ppm CO2. What do you think would happen to temperature, ice cover of oceans, and water vapor in the atmosphere?
E. Reflect and Connect
Summarize some ideas from this lesson with the following questions:
- In the Earth system, some events are a strong forcing, like the "spike" simulation. For example, imagine a volcanic eruption that fills the air around it with ash and gas. Do you think that this might result in cooling or warming of the atmosphere?
You are not expected to know this answer, but it may help you think about forcings in systems. You'll learn more about this forcing in Unit 3. - In the simulation, you saw that it took a while for temperature, water vapor, and ice cover to "catch up" after the CO2 spike. The total response took about 80 years. What is the significance of this for factors that could change the CO2 levels of Earth's atmosphere?