


Unit 1: Carbon & Climate in the Past
1.5: Core Connections
FOCUS QUESTION:
Compared with climate indicators such as CO2 levels or global ice volume, what other indicators can tell you about Earth's past climate? How do these indicators relate to the carbon cycle?
Introduction
In this unit, you have investigated real data. These data are the evidence for variations in Earth's climate in the past. A key part of this climate story is the carbon forms moving in the Earth system. Changes in the climate also connect to the carbon cycle. You will investigate the carbon cycle and climate more in Units 2 and 3.
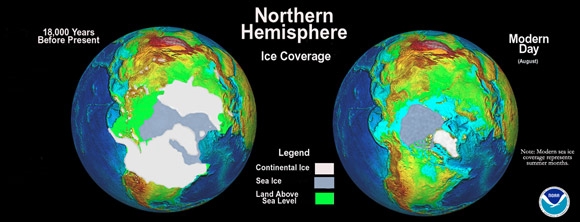
If someone mentions an ice age, you are likely to think of the great ice sheets in the regions of Earth's poles. The Northern Hemisphere image, for example, emphasizes the changing sizes of continental and sea ice in the Arctic. A broader issue for scientists is testing whether a glacial period is related to the global climate. To find out, you would need to examine other locations on Earth, and perhaps some other proxy records for climate. You will do just that in this lesson as you take two virtual field trips. In general, you will solidify your understandings that:
- Data from other locations also show evidence of climate variations on Earth, and that climate connects to the carbon cycle.
- Climate change in the past has had a pronounced effect on changes in ecosystems.
- Learning about the carbon cycle and the climate in the Earth system relies on bringing together many disciplines in science.
You have investigated several indicators of climate, such as CO2 levels, ice volume, and Antarctica temperature variations. In this lesson, you will make more connections between carbon and climate with two field trips, where you will analyze some other climate indicators. This is a great way to show what you have learned. Listen to your teacher for what to turn in for this lesson.
A. Key Things You Learned in Unit 1
Before you start your activity, you may want to review what you've learned so far.
Lesson 1.1
- Carbon dioxide (CO2) is an important molecule that contains carbon.
- You can use models to demonstrate the transfer of carbon in the Earth system.
- You can use chemical indicators as color to monitor changes in solutions.
Lesson 1.2
- The snow of ice sheets preserve tiny samples of air from Earth's past.
- Samples of air from ice cores show the relationship between CO2 levels and temperature for climate in Earth's past.
Lesson 1.3
- Forcings lead to responses or changes in systems.
- Forcings in the Earth system can cause climate to change.
- Greenhouse gases affect the temperature of Earth's atmosphere.
- Model and simulations can help you understand forcings in Earth's climate system.
Lesson 1.4
- Investigate whether climate signals are global or regional.
- Analyze other indicators of climate cycles on Earth.
- Use models of molecules (foam balls) to simulate physical processes on Earth.
B. Field Trips
In Lesson 1.4, you investigated a record of the size of ice sheets. The global ice-volume record showed times of large ice sheets (glacial periods, or glacials), and times when ice sheets were small and mostly restricted to Greenland and Antarctica (interglacial periods, or interglacials). These occurred at high latitudes and away from the equator. But is there a record of past climates cycles around the equator? If so, what might that evidence look like at the Equator? Let's explore this with a field trip to the Galápagos Islands.
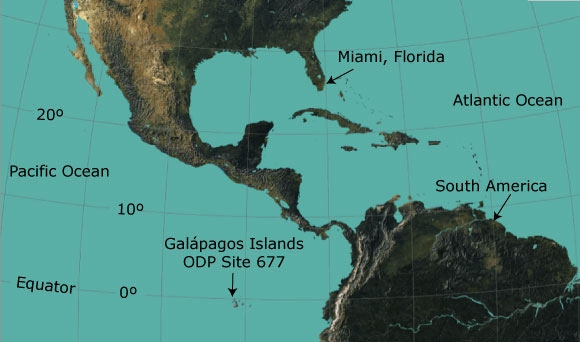
GALÁPAGOS ISLANDS, ECUADOR, FIELD TRIP
The Galápagos Islands are a cluster of large, volcanic islands in the equatorial Pacific Ocean. The islands are just west of Ecuador, South America. The waters are warm and tropical. Perhaps you have read about these islands in your science class. Animals collected at the Galápagos Islands and South America helped Charles Darwin develop the theory of biological evolution.
The Pacific Ocean around the Galápagos Islands abounds with marine life, including foraminifera (forams). The waters have been that way for millions of years. Geologists have obtained long cores of marine sediments that contain forams from a drilling site called ODP (Ocean Drilling Project) Site 677. This helps the geologists determine the δ18O of ocean water at that locality in the geologic past.
- Launch the Forams Data interactive, which shows two types of forams. Note that the y-axis does not have units. This is because you will be comparing different types of data. To compare data and answer the following questions, you need to move the data up and down. Use the interactive to answer these questions:
- Overall, do you think the data from the two different types of forums tell a similar or different story about the δ18O pattern for ocean water?
- In the Forums Data interactive, look at the records for atmospheric CO2 and temperature from Antarctica. You studied these in Lesson 1.2. How do these data compare with δ18O signal for ocean water at the Galápagos Islands?
- Compare another record, the global ice volume signal, with the δ18O record from ocean water. Do these records correlate? Does one cause the other?
Click to select a record, then use mouse to drag the curve up or down. - Summarize what you found from the Galápagos Islands data. Do foram δ18O values from warm, tropical oceans preserve a record of global climate patterns? Explain why you would, or would not, expect this.
Explore More: Two Types of Forams
Two Types of Forams
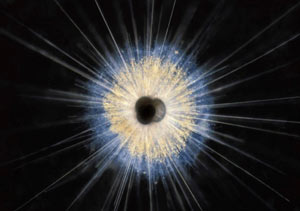
The δ18O data for forams from the Galápagos Islands come from two varieties; each is a key part of marine ecosystems. One type is planktonic foraminifera. Planktonic forams thrive in the photic zone of oceans. This is the upper 100-200 meters, where light penetrates and photosynthesis occurs. In this zone, primary producers (such as diatoms and single-celled algae) transfer carbon in the oceans to organisms of marine food webs. They do this by photosynthesis, the process of using CO2 in the oceans to create their tissues. You will learn more about photosynthesis in Unit 2.
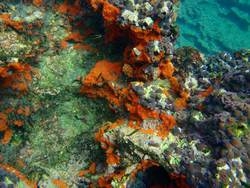
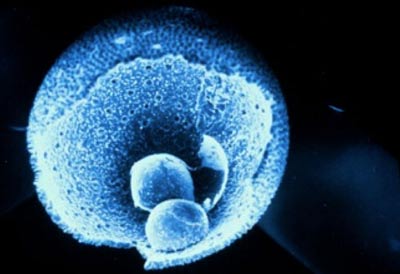
Planktonic foraminifera consume these primary producers. In other words, the planktonic forams are primary consumers because they eat the producers. When the planktonic forams die, or when they themselves are eaten, their carbon-bearing remains sink to the seafloor. Recall that this part is the calcium carbonate test. This is all that remains after the organic tissues of the foram either are digested or decompose in the ocean. The image shows an example of a carbonate test that became part of the seafloor sediments.
Another type is benthicforaminifera. Benthic forams live on the seafloor. By comparison, other types of benthic organisms also live at the bottom of lake ecosystems. Because temperatures are much colder in deeper ocean waters, benthic forams have a different δ18O values than planktonic foraminifera. The key question is whether the pattern of δ18O curves is similar or different for benthic and planktonic forams. What do you see in the data from ODP Site 677 at the Galápagos Islands? Use the interactive to compare these foram data with some other global data sets that you have studied. That's question 2 from the previous section.
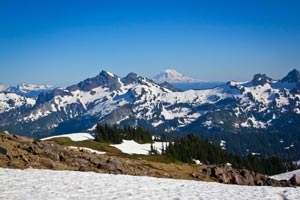
Pacific Northwest Field Trips
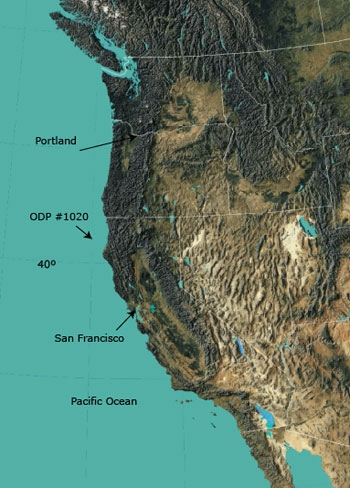
Let's take another field trip! This time, we're visiting the open waters of the Pacific Ocean, offshore of northern California and Oregon. This region is the Pacific Northwest. It is at mid-latitudes, about halfway between the equator and the North Pole. On this field trip, you will examine data from a drill core to see whether the sediment keeps a record of climate variation. You will also investigate what the climate indicators tell you about ecosystems and the carbon cycle in the Pacific Northwest. This will help you answer your focus questions.
The cores are from the deep-sea muds at ODP Site 1020. There, large rivers have flushed sediments from the rugged mountains of the Cascades down to the Pacific Ocean. Along with mud and silt, these rivers also contain the pollen of plants and trees that live in the mountains.
By looking at the types of pollen in the core, you can infer the kinds of vegetation that lived in the mountains. This, in turn, gives us key clues about climate. When the climate in the Pacific Northwest was cold and dry, the pollen in the rivers show that the mountains had more plants that lived in a cold, dry climate. In contrast, when the climate in the Pacific Northwest was warm and wet, the pollen in the rivers indicate plant varieties that live in that kind of climate. You will use the data from ODP Site 1020 to see what plants these are. The Pollen Journey video will show you a bit more about rivers and pollen in the Pacific Northwest.
The ocean waters above ODP Site 1020 region are rich with marine life, including forams. Geologists have measured the δ18O of those forams. In addition, another chemical indicator from the forams tells geologists the temperature of the ocean water where the forams lived. You will continue to use these data to make inferences about the climate and ecosystems in the Pacific Northwest.
On your field trip to this site, use the geologic data in the interactive to answer the questions below.
If you are unable to see the interactive, click here to open it in a new tab.
- Open the Pollen Indicator interactive. You should see these data from sediments at ODP Site 1020:
- Sea surface temperature (SST)
- δ18O data for forams at Site 1020
- Species of plants, given as percent of all pollen in a core sample
- An indicator of warm, wet climate (on average)
- An indicator of cold, dry climate (on average) Click to select a record, then use mouse to drag the curve up or down.
- Compare the δ18O of forams between ODP Site 1020 and the Galápagos (Site 677). Do forams from Site 1020 preserve a record of global climate? Compare this record with other records, such as ODP Site 677, CO2 levels, or global ice volume. Use specific years from the graph as your evidence.
Hint: Use the sea surface temperature from Site 1020 to help support your case. - Next, analyze the pollen records. Starting with redwood (Sequoia), use these steps to determine whether they were more abundant in the ecosystem in glacial or interglacial periods.
- Large peaks show times when pollen was common in rivers, and thus common in sediments on the seafloor. A flat line indicates few, or no, redwoods. How many major peaks do you see?
- Select another global climate record, such as global ice volume or atmospheric CO2. Use this record to determine whether redwoods were more common during glacial or interglacial periods.
- Two curves are shown for times when the average climate was warm and wet, or when it was cold and dry. Compare the redwood pollen record to each. In which climate do redwoods thrive? Is this a glacial or interglacial period?
- Look at the four remaining pollen records: Oak, Sage, Gramma, and Alder. Use the following steps to determine whether each type of pollen was more abundant when the average regional climate was warm and wet, or cold and dry.
- Make a Regional Climate table to record your evidence.
- See the example results entered for redwood, which has a check mark for relatively warm, wet regional climate. In the column to the right, note the evidence that supports the selection of a warm, wet regional climate. You will enter more evidence like this from climate records of other plant species.
- Continue to fill in your table with results for oak, sage, gramma, and alder.
| Pollen type | Regional climate | Evidence for the average regional climate | |
|---|---|---|---|
| Warm, wet | Cold, dry | ||
| Redwood | X | Peaks in redwood pollen correlate with peaks in atmospheric CO2 levels, low global ice volume, and interglacial periods like today. | |
| Oak | |||
| Sage | |||
| Gramma | |||
| Alder | |||
- Select just the redwood data from Site 1020 and the foram δ18O signal data from Site 677. Look at the relationship between these records: Each indicates glacial and interglacial epochs. Would you say that the relationship is a cause or a correlation? Explain your logic.
- To summarize, think about the record of glacial-interglacial cycles and the plants in ecosystems in the Pacific Northwest. In Lesson 1.2, you saw that interglacials have a lot of carbon stored as biomass on land, while glacials had much less vegetation on land. Are ecosystem patterns in the Pacific Northwest consistent with this, or different?
Hint: Think about the size and height of plants that represent the two climates.
Explore More: Spruce Bonus
Spruce Bonus
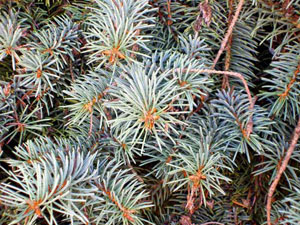
Spruce is another interesting plant in the Pacific Northwest. See if you can tell whether spruce is relatively more common during glacial or interglacials in the Pacific Northwest. If you are able to graph data in your class, do these steps:
- Click the Download NASA 1020 Picea Data button below.
- Graph spruce pollen (% of total) on the y-axis against sediment age (years) on the x-axis.
- Use a record such as global ice volume or atmospheric CO2 to identify whether, on average, the peaks correspond with glacials or interglacials.
C. Reflect and Connect
At the end of Unit 1, it is a good time to reflect on some key concepts. Your teacher will tell you which of the following questions to complete and when they are due.
- Think about your process of learning in Unit 1. What way, or ways, helped you learn the lessons?
- What is your current thinking about how the carbon cycle is related to climate? List two examples from Unit 1 to support your answer.
- In this unit, you have studied natural climate variations on Earth. This included variations between glacial and interglacial cycles. How do you think that studying Earth's past climate can help you understand present variations in climate?
- Some key fields of science are life science, earth science, chemistry, physics, and engineering.
- In which field(s) of science would you place the concept of the carbon cycle?
- In which field(s) of science would you place the study of climate science? Why?
- What is another topic or issue in society that relies on more than one of the disciplines above (for example, food production and agriculture)?
- You studied data from an ice core in the Antarctic ice sheet (EPICA). It compared CO2 levels and temperature there for the past 650,000 years. The Carbon Dioxide Record graph shows the last 140,000 years of those data. It also includes CO2 levels measured from Law Dome (Antarctica; see Carbon Dioxide Concentrations graph) and Mauna Loa (Hawaii).
- Describe CO2 levels in recent times. What are the levels?
- How do current CO2 levels compare with prior patterns of glacial and interglacial cycles?
- Given current CO2 levels, what do you predict could be a future outcome for Earth's climate? What other evidence in this unit supports your reasoning?
- The Carbon Dioxide Concentrations graph shows CO2 levels in the atmosphere the past 2,000 years. Data to about 1900 are from the Law Dome, Antarctica.
- What is the main feature you see in these data for CO2 levels? What year is the feature found?
- List your ideas for how to explain feature(s) that you see. It's OK if you don't know the answer, but start thinking about some possibilities.